United States · The summary is refreshed every 15 minutes.
October 22
The air is moderate now
Chicago
16°C
Clear
82AQI
1023hPa
Atmospheric pressure
78%
Humidity
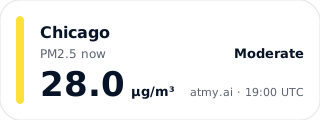
Chicago, October 21, 2026: daily mean PM2.5 25 µg/m³ (7 sensors), level “Moderate” — as in the Atmy Data Hub. Now (13:00 local time): 25.9 µg/m³. Open methodology and data in JSON: Methodology and data sources · JSON
Right now in Chicago, PM2.5 averages 25.9 µg/m³ — “moderate” on the US EPA scale (approximate, from hourly readings). Mean of 7 sensors on the Atmy network, readings from 12:47–12:47 local time (17:47–17:47 UTC), summary prepared at 13:00 local time. Median: 27.8 µg/m³; range across sensors: 14.7–33.2 µg/m³.
In Chicago the air is moderate right now (approximate, US EPA scale). From 00:00 to 13:00 local time the city mean PM2.5 stayed roughly level: from 28.4 to 25.9 µg/m³. The highest hour was 08:00 with 36.3 µg/m³.
The wind is weak (2 m/s): particles are likely accumulating near the ground.
Weather now: clear, 16°C, wind 2 m/s, humidity 78%. No major change in the wind is expected in the coming hours. By 00:00 the temperature will be about 11°C.
Written automatically at 13:00 local time (18:00 UTC) from sensor measurements and the weather forecast. Values are approximate; hypotheses are marked.
7 km/h
Wind, E
0 mm
Precipitation today
Chicago: air quality for the completed day
Metric: PM2.5, µg/m³ · Color scale: EPA AQI · October 21, 2026 · 00:00–24:00 UTC
25 µg/m³ Moderate
Daily mean PM2.5 on October 21, 2026 (00:00–24:00 UTC): 25 µg/m³ from 7 sensors that passed the quality check — the same value as in the Atmy Data Hub.
LowModerateElevatedHighVery highExtremely high
Air Quality in United States for the Completed Day
Metric: PM2.5, µg/m³ · Color scale: EPA AQI · October 21, 2026 · 00:00–24:00 UTC
Highest current reading: 33.2 µg/m³ (Wells & Ontario Bus Station). Lowest: 14.7 µg/m³ (Chicago-Logan Square). The list shows every sensor, highest first.
What was the air quality in Chicago over the last completed day?
Daily mean PM2.5 on October 21, 2026 (00:00–24:00 UTC): 25 µg/m³ from 7 sensors that passed the quality check — the same value as in the Atmy Data Hub.
What is the air quality in Chicago right now?
Right now in Chicago, PM2.5 averages 25.9 µg/m³ — “moderate” on the US EPA scale (approximate, from hourly readings). Mean of 7 sensors on the Atmy network, readings from 12:47–12:47 local time (17:47–17:47 UTC), summary prepared at 13:00 local time. Median: 27.8 µg/m³; range across sensors: 14.7–33.2 µg/m³.
Is it safe to be outdoors in Chicago now?
The current level is “moderate” (US EPA scale, approximate). Unusually sensitive people should consider reducing prolonged or heavy exertion outdoors. This is the standard guidance of the scale, not medical advice.
Where in Chicago is the air worse?
Highest current reading: 33.2 µg/m³ (Wells & Ontario Bus Station). Lowest: 14.7 µg/m³ (Chicago-Logan Square). The list shows every sensor, highest first.
Where do these data come from?
From Atmy sensors and connected public networks (citizen, experimental and government monitors), aggregated by Atmy. Values are approximate; see the methodology.
How often is this page updated?
The summary is rebuilt every 15 minutes from the latest reading of each sensor, each no older than one hour.
Is the air in Chicago polluted?
Over the last 353 days with data, the mean daily PM2.5 in Chicago was 12.9 µg/m³ — 2.6 times the WHO annual guideline (5 µg/m³). Over the last 30 days: 9.7 µg/m³. From Atmy's archive of daily city means.
When is the air in Chicago cleanest?
In Atmy's daily archive, the cleanest month of the last year was May 2026: 7.1 µg/m³ on average.
When is the air in Chicago most polluted?
The most polluted month of the last year was July 2026: 33.3 µg/m³ on average.
Is the air in Chicago worse in the heating season?
From November to March the mean daily PM2.5 was 12.1 µg/m³, from June to August 19.9 µg/m³ (last 365 days).
Data
Where do these data come from?
The daily value is the Data Hub’s: the mean of the city’s sensors that passed the nightly quality check, each with at least 12 valid hours, and only with sensors at four places 500 m apart; days are UTC.
“Now” uses the same sensors and rule: the mean of their latest readings, each at most 60 minutes old, shown only with sensors at four places 500 m apart reporting.
 October 22