Open full map

Beaverton air quality now

United States · The summary is refreshed every 15 minutes.

10 µg/m³ Moderate Measured 09:00–09:48

More below

November 19

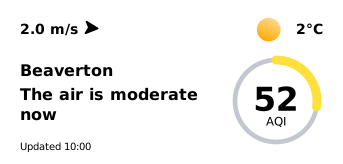
The air is moderate now

Measured 09:00–09:48

Beaverton

2°C

Clear

52AQI

1013

hPa

Atmospheric
pressure

88%

Humidity

Beaverton, November 18, 2026: daily mean PM2.5 9 µg/m³ (9 sensors), level “Low” — as in the Atmy Data Hub. Now (10:00 local time): 9.5 µg/m³. Open methodology and data in JSON: Methodology and data sources · JSON

Right now in Beaverton, PM2.5 averages 9.5 µg/m³ — “moderate” on the US EPA scale (approximate, from hourly readings). Mean of 9 sensors from AirGradient, Government stations, Sensor.Community, readings from 09:00–09:48 local time (17:00–17:48 UTC), summary prepared at 10:00 local time. Median: 10.0 µg/m³; range across sensors: 1.0–17.3 µg/m³.

In Beaverton the air is moderate 🟡 AQI 52. Higher than three hours ago. ☀️ +2 °C · No precipitation · Wind 2 m/s

In Beaverton the air is moderate right now (approximate, US EPA scale). From 21:00 to 10:00 local time the city mean PM2.5 rose from 5.2 to 9.5 µg/m³.

The wind is weak (2 m/s): particles are likely accumulating near the ground. Cold weather (2°C) possibly means more heating, a common source of particles.

Weather now: clear, 2°C, wind 2 m/s, humidity 88%. No major change in the wind is expected in the coming hours.

Written automatically at 10:00 local time (18:00 UTC) from sensor measurements and the weather forecast. Values are approximate; hypotheses are marked.

2 m/s

Wind, W

0 mm

Precipitation today

Beaverton: air quality for the completed day

Metric: PM2.5, µg/m³ · Color scale: EPA AQI · November 18, 2026 · 00:00–24:00 UTC = 16:00–16:00 UTC-8

9 µg/m³ Low

Daily mean PM2.5 on November 18, 2026 (00:00–24:00 UTC = 16:00–16:00 UTC-8): 9 µg/m³ from 9 sensors that passed the quality check — the same value as in the Atmy Data Hub.

LowModerateElevatedHighVery highExtremely high

Beaverton: PM2.5 by month

Metric: PM2.5, µg/m³ · Color scale: EPA AQI

Mean
Nov
Dec
Jan
Feb
Mar
Apr
May
Jun
Jul
Aug
Sep
Oct
This month
6
10
7
8
5
3
3
3
2
4
13
5
6
15

Monthly means of quality-checked sensors, as in the Data Hub trend; the current month is still incomplete, “-” means no data.

Pollution accumulation index now

64/100Moderate · An estimate of weather conditions · not a PM2.5 forecast

Now6478
10.0018.0001.0009.00

Pollution accumulation forecast

Today — November 19

10°/1°

Index by time of day

86/100High

  1. 86/100Night
  2. 81/100Morning
  3. 70/100Day
  4. 78/100Evening

Friday — November 20

10°/1°

Index by time of day

83/100High

  1. 81/100Night
  2. 78/100Morning
  3. 67/100Day
  4. 83/100Evening

Saturday — November 21

9°/4°

Index by time of day

88/100High

  1. 86/100Night
  2. 88/100Morning
  3. 76/100Day
  4. 44/100Evening

Sunday — November 22

10°/5°

Index by time of day

75/100High

  1. 50/100Night
  2. 41/100Morning
  3. 75/100Day
  4. 19/100Evening

Monday — November 23

12°/6°

Index by time of day

80/100High

  1. 20/100Night
  2. 39/100Morning
  3. 76/100Day
  4. 80/100Evening

Tuesday — November 24

8°/6°

Index by time of day

75/100High

  1. 75/100Night
  2. 63/100Morning
  3. 50/100Day
  4. 61/100Evening

Forecast of conditions that trap pollution near the surface

Weather

2°

Clear. Feels like -2°C

  1. MorningClear4°C92%
  2. DayClear9°C75%
  3. EveningClear4°C83%

Wind

2m/sWind from the W

2m/sWind gusts

Wind force: 2

Gusts up to 5 m/s are expected.

10-day weather forecast for Beaverton

United States

  1. TodayNov 19Partly cloudy10°C1°C
  2. FriNov 20Cloudy10°C1°C
  3. SatNov 21Rain9°C4°C
  4. SunNov 22Rain10°C5°C
  5. MonNov 23Rain12°C6°C
  6. TueNov 24Cloudy8°C6°C
  7. WedNov 25Rain8°C6°C
  8. ThuNov 26Cloudy10°C5°C
  9. FriNov 27Cloudy10°C6°C
  10. SatNov 28Cloudy10°C6°C

Where in Beaverton is the air worse?

See all sensors

Highest current reading: 17.3 µg/m³ (Hart's Landing). Lowest: 1.0 µg/m³ (Pumpkin Ridge, North Plains). The list shows every sensor, highest first.

  1. Hart's Landing →17 µg/m³
  2. SW Barnes Road in east Washington County Oregon →16 µg/m³
  3. Hillsboro - Hare Field (Oregon Dept. of Environmental Quality) →13 µg/m³
  4. Forest Grove Pacific University (Oregon Dept. of Environmental Quality) →10 µg/m³
  5. Portland Near Road (Oregon Dept. of Environmental Quality) →10 µg/m³
  6. Withywindle →9 µg/m³
  7. Beaverton - Highland Park School (Oregon Dept. of Environmental Quality) →7 µg/m³
  8. SC #6374 →3 µg/m³
  9. Pumpkin Ridge, North Plains →1 µg/m³

Source: atmy.ai monitoring network

Who provides the data

Sensors in the summary by network: AirGradient — 4 sensors, Government stations — 4 sensors, Sensor.Community — 1 sensor.

Atmy shows the networks’ readings after the Data Hub’s quality check: test devices and sensors that fail it are left out.

United States: sensors in total

534

  1. New YorkUnited States

    17
  2. SpokaneUnited States

    16
  3. PortlandUnited States

    14

Cities with the most sensors

All sensors on the map, by city as the map assigns them; the city’s values count only the sensors that pass the Data Hub’s quality check.

Air quality calendar: Beaverton

Daily mean PM2.5 of the city sensors, µg/m³

Click a day to see its date and value.

LowModerateElevatedHighVery highExtremely high

Widget for your site

An Atmy card with the air quality in Beaverton now: it is refreshed every 15 minutes and links to this page. Paste the code into your site.

Air quality in Beaverton now — Atmy

Questions

What was the air quality in Beaverton over the last completed day?

Daily mean PM2.5 on November 18, 2026 (00:00–24:00 UTC = 16:00–16:00 UTC-8): 9 µg/m³ from 9 sensors that passed the quality check — the same value as in the Atmy Data Hub.

What is the air quality in Beaverton right now?

Right now in Beaverton, PM2.5 averages 9.5 µg/m³ — “moderate” on the US EPA scale (approximate, from hourly readings). Mean of 9 sensors from AirGradient, Government stations, Sensor.Community, readings from 09:00–09:48 local time (17:00–17:48 UTC), summary prepared at 10:00 local time. Median: 10.0 µg/m³; range across sensors: 1.0–17.3 µg/m³.

Is it safe to be outdoors in Beaverton now?

The current level is “moderate” (US EPA scale, approximate). Unusually sensitive people should consider reducing prolonged or heavy exertion outdoors. This is the standard guidance of the scale, not medical advice.

Where in Beaverton is the air worse?

Highest current reading: 17.3 µg/m³ (Hart's Landing). Lowest: 1.0 µg/m³ (Pumpkin Ridge, North Plains). The list shows every sensor, highest first.

Where do these data come from?

From Atmy sensors and connected public networks (citizen, experimental and government monitors), aggregated by Atmy. Values are approximate; see the methodology.

How often is this page updated?

The summary is rebuilt every 15 minutes from the latest reading of each sensor, each no older than one hour.

Data

Where do these data come from?

The daily value is the Data Hub’s: the mean of the city’s sensors that passed the nightly quality check, each with at least 12 valid hours, and only with sensors at four places 500 m apart; days are UTC.

“Now” uses the same sensors and rule: the mean of their latest readings, each at most 60 minutes old, shown only with sensors at four places 500 m apart reporting.

Source: public Atmy monitoring data. Methodology and data sources · Data terms