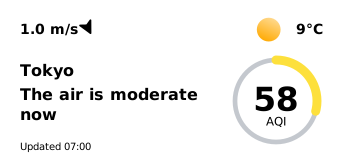
Tokyo air quality now

Japan · The summary is refreshed every 15 minutes.

November 12

The air is moderate now

Measured 05:00–06:56

Tokyo

9°C

Partly cloudy

58AQI

1029

hPa

Atmospheric
pressure

76%

Humidity

Tokyo, November 10, 2026: daily mean PM2.5 5 µg/m³ (51 sensors), level “Low” — as in the Atmy Data Hub. Now (07:00 local time): 12.7 µg/m³. Open methodology and data in JSON: Methodology and data sources · JSON

Right now in Tokyo, PM2.5 averages 12.7 µg/m³ — “moderate” on the US EPA scale (approximate, from hourly readings). Mean of 49 sensors from Government stations, Sensor.Community, AirGradient, readings from 05:00–06:56 local time (20:00–21:56 UTC), summary prepared at 07:00 local time. Median: 12.0 µg/m³; range across sensors: 8.0–23.0 µg/m³.

In Tokyo the air is moderate 🟡 AQI 58. About the same as three hours ago. ⛅ +9 °C · No precipitation · Wind 1 m/s

In Tokyo the air is moderate right now (approximate, US EPA scale). From 18:00 to 07:00 local time the city mean PM2.5 stayed roughly level: from 11.5 to 12.7 µg/m³.

Light wind (1 m/s) in the evening or at night, as the air cools, possibly traps particles near the ground (a temperature inversion).

Weather now: partly cloudy, 9°C, wind 1 m/s, humidity 76%. No major change in the wind is expected in the coming hours. By 18:00 the temperature will be about 15°C.

Written automatically at 07:00 local time (22:00 UTC) from sensor measurements and the weather forecast. Values are approximate; hypotheses are marked.

1 m/s

Wind, NNW

0 mm

Precipitation today

Tokyo: air quality for the completed day

Metric: PM2.5, µg/m³ · Color scale: EPA AQI · November 10, 2026 · 00:00–24:00 UTC = 09:00–09:00 UTC+9

5 µg/m³ Low

Daily mean PM2.5 on November 10, 2026 (00:00–24:00 UTC = 09:00–09:00 UTC+9): 5 µg/m³ from 51 sensors that passed the quality check — the same value as in the Atmy Data Hub.

No. 21 of 43 cities in Japan and No. 634 of 676 worldwide, from the most polluted.

LowModerateElevatedHighVery highExtremely high

Pollution accumulation index now

43/100Moderate · An estimate of weather conditions · not a PM2.5 forecast

Now4346
07.0015.0022.0006.00

Pollution accumulation forecast

Today — November 12

17°/9°

Index by time of day

55/100Moderate

  1. 55/100Night
  2. 44/100Morning
  3. 10/100Day
  4. 25/100Evening

Friday — November 13

19°/9°

Index by time of day

60/100Moderate

  1. 60/100Night
  2. 46/100Morning
  3. 10/100Day
  4. 25/100Evening

Saturday — November 14

20°/11°

Index by time of day

58/100Moderate

  1. 58/100Night
  2. 44/100Morning
  3. 9/100Day
  4. 23/100Evening

Sunday — November 15

18°/12°

Index by time of day

51/100Moderate

  1. 51/100Night
  2. 39/100Morning
  3. 9/100Day
  4. 21/100Evening

Monday — November 16

19°/12°

Index by time of day

45/100Moderate

  1. 45/100Night
  2. 33/100Morning
  3. 8/100Day
  4. 26/100Evening

Tuesday — November 17

14°/10°

Index by time of day

43/100Moderate

  1. 43/100Night
  2. 33/100Morning
  3. 7/100Day
  4. 19/100Evening

Forecast of conditions that trap pollution near the surface

Weather

9°

Partly cloudy. Feels like 7°C

  1. MorningClear11°C66%
  2. DayClear17°C62%
  3. EveningClear14°C81%

Wind

1m/sWind from the NNW

4m/sWind gusts

Wind force: 1

Light wind is expected over the next few hours.

10-day weather forecast for Tokyo

Japan

  1. TodayNov 12Partly cloudy17°C9°C
  2. FriNov 13Partly cloudy19°C9°C
  3. SatNov 14Partly cloudy20°C11°C
  4. SunNov 15Rain18°C12°C
  5. MonNov 16Rain19°C12°C
  6. TueNov 17Rain14°C10°C
  7. WedNov 18Rain21°C10°C
  8. ThuNov 19Fog17°C9°C
  9. FriNov 20Partly cloudy15°C7°C
  10. SatNov 21Partly cloudy14°C7°C

Where in Tokyo is the air worse?

See all sensors

Highest current reading: 23.0 µg/m³ (SC #53658). Lowest: 8.0 µg/m³ (日比谷交差点 (環境省 大気汚染物質広域監視システム(そらまめくん) — 東京都)). The list shows every sensor, highest first.

  1. SC #53658 →23 µg/m³
  2. SC #64114 →23 µg/m³
  3. Meguro, Japan →18 µg/m³
  4. 環七通り亀有 (環境省 大気汚染物質広域監視システム(そらまめくん) — 東京都) →18 µg/m³
  5. 京葉道路亀戸 (環境省 大気汚染物質広域監視システム(そらまめくん) — 東京都) →15 µg/m³
  6. 明治通り大関横丁 (環境省 大気汚染物質広域監視システム(そらまめくん) — 東京都) →15 µg/m³
  7. 江戸川区鹿骨 (環境省 大気汚染物質広域監視システム(そらまめくん) — 東京都) →15 µg/m³
  8. 荒川区南千住 (環境省 大気汚染物質広域監視システム(そらまめくん) — 東京都) →15 µg/m³
  9. 環八通り八幡山 (環境省 大気汚染物質広域監視システム(そらまめくん) — 東京都) →15 µg/m³
  10. 練馬区石神井台 (環境省 大気汚染物質広域監視システム(そらまめくん) — 東京都) →14 µg/m³
+39 more sensors
  1. 甲州街道大原 (環境省 大気汚染物質広域監視システム(そらまめくん) — 東京都) →14 µg/m³
  2. 環七通り柿の木坂 (環境省 大気汚染物質広域監視システム(そらまめくん) — 東京都) →14 µg/m³
  3. 江東区大島 (環境省 大気汚染物質広域監視システム(そらまめくん) — 東京都) →13 µg/m³
  4. 港区台場 (環境省 大気汚染物質広域監視システム(そらまめくん) — 東京都) →13 µg/m³
  5. 練馬区練馬 (環境省 大気汚染物質広域監視システム(そらまめくん) — 東京都) →13 µg/m³
  6. 足立区西新井 (環境省 大気汚染物質広域監視システム(そらまめくん) — 東京都) →13 µg/m³
  7. 足立区綾瀬 (環境省 大気汚染物質広域監視システム(そらまめくん) — 東京都) →13 µg/m³
  8. 文京区本駒込 (環境省 大気汚染物質広域監視システム(そらまめくん) — 東京都) →13 µg/m³
  9. 日光街道梅島 (環境省 大気汚染物質広域監視システム(そらまめくん) — 東京都) →13 µg/m³
  10. 中山道大和町 (環境省 大気汚染物質広域監視システム(そらまめくん) — 東京都) →13 µg/m³
  11. 葛飾区鎌倉 (環境省 大気汚染物質広域監視システム(そらまめくん) — 東京都) →13 µg/m³
  12. 新目白通り下落合 (環境省 大気汚染物質広域監視システム(そらまめくん) — 東京都) →12 µg/m³
  13. 山手通り大坂橋 (環境省 大気汚染物質広域監視システム(そらまめくん) — 東京都) →12 µg/m³
  14. 練馬区北町 (環境省 大気汚染物質広域監視システム(そらまめくん) — 東京都) →12 µg/m³
  15. 国設東京(新宿) (環境省 大気汚染物質広域監視システム(そらまめくん) — 環境省) →12 µg/m³
  16. 目黒区碑文谷 (環境省 大気汚染物質広域監視システム(そらまめくん) — 東京都) →12 µg/m³
  17. 北本通り王子 (環境省 大気汚染物質広域監視システム(そらまめくん) — 東京都) →12 µg/m³
  18. 春日通り大塚 (環境省 大気汚染物質広域監視システム(そらまめくん) — 東京都) →12 µg/m³
  19. 板橋区氷川町 (環境省 大気汚染物質広域監視システム(そらまめくん) — 東京都) →12 µg/m³
  20. 千代田区神田司町 (環境省 大気汚染物質広域監視システム(そらまめくん) — 東京都) →12 µg/m³
  21. 港区高輪 (環境省 大気汚染物質広域監視システム(そらまめくん) — 東京都) →11 µg/m³
  22. 中原口交差点 (環境省 大気汚染物質広域監視システム(そらまめくん) — 東京都) →11 µg/m³
  23. 江戸川区春江町 (環境省 大気汚染物質広域監視システム(そらまめくん) — 東京都) →11 µg/m³
  24. 大田区東糀谷 (環境省 大気汚染物質広域監視システム(そらまめくん) — 東京都) →11 µg/m³
  25. 品川区豊町 (環境省 大気汚染物質広域監視システム(そらまめくん) — 東京都) →11 µg/m³
  26. 杉並区久我山 (環境省 大気汚染物質広域監視システム(そらまめくん) — 東京都) →11 µg/m³
  27. 渋谷区本町 (環境省 大気汚染物質広域監視システム(そらまめくん) — 東京都) →11 µg/m³
  28. 世田谷区成城 (環境省 大気汚染物質広域監視システム(そらまめくん) — 東京都) →11 µg/m³
  29. 第一京浜高輪 (環境省 大気汚染物質広域監視システム(そらまめくん) — 東京都) →11 µg/m³
  30. 葛飾区水元公園 (環境省 大気汚染物質広域監視システム(そらまめくん) — 東京都) →11 µg/m³
  31. 中央区晴海 (環境省 大気汚染物質広域監視システム(そらまめくん) — 東京都) →11 µg/m³
  32. 三ツ目通り辰巳 (環境省 大気汚染物質広域監視システム(そらまめくん) — 東京都) →11 µg/m³
  33. 中野区若宮 (環境省 大気汚染物質広域監視システム(そらまめくん) — 東京都) →10 µg/m³
  34. 明治通り西巣鴨 (環境省 大気汚染物質広域監視システム(そらまめくん) — 東京都) →10 µg/m³
  35. 品川区八潮 (環境省 大気汚染物質広域監視システム(そらまめくん) — 東京都) →10 µg/m³
  36. 水戸街道東向島 (環境省 大気汚染物質広域監視システム(そらまめくん) — 東京都) →10 µg/m³
  37. 環七通り松原橋 (環境省 大気汚染物質広域監視システム(そらまめくん) — 東京都) →9 µg/m³
  38. 国設新宿 (環境省 大気汚染物質広域監視システム(そらまめくん) — 環境省) →9 µg/m³
  39. 日比谷交差点 (環境省 大気汚染物質広域監視システム(そらまめくん) — 東京都) →8 µg/m³

Source: atmy.ai monitoring network

Who provides the data

Sensors in the summary by network: Government stations — 46 sensors, Sensor.Community — 2 sensors, AirGradient — 1 sensor.

Atmy shows the networks’ readings after the Data Hub’s quality check: test devices and sensors that fail it are left out.

Japan: sensors in total

921

  1. TokyoJapan

    49
  2. NagoyaJapan

    18
  3. KobeJapan

    16

Cities with the most sensors

All sensors on the map, by city as the map assigns them; the city’s values count only the sensors that pass the Data Hub’s quality check.

Air quality calendar: Tokyo

Daily mean PM2.5 of the city sensors, µg/m³

Click a day to see its date and value.

LowModerateElevatedHighVery highExtremely high

Widget for your site

An Atmy card with the air quality in Tokyo now: it is refreshed every 15 minutes and links to this page. Paste the code into your site.

Air quality in Tokyo now — Atmy

Questions

What was the air quality in Tokyo over the last completed day?

Daily mean PM2.5 on November 10, 2026 (00:00–24:00 UTC = 09:00–09:00 UTC+9): 5 µg/m³ from 51 sensors that passed the quality check — the same value as in the Atmy Data Hub. No. 21 of 43 cities in Japan and No. 634 of 676 worldwide, from the most polluted.

What is the air quality in Tokyo right now?

Right now in Tokyo, PM2.5 averages 12.7 µg/m³ — “moderate” on the US EPA scale (approximate, from hourly readings). Mean of 49 sensors from Government stations, Sensor.Community, AirGradient, readings from 05:00–06:56 local time (20:00–21:56 UTC), summary prepared at 07:00 local time. Median: 12.0 µg/m³; range across sensors: 8.0–23.0 µg/m³.

Is it safe to be outdoors in Tokyo now?

The current level is “moderate” (US EPA scale, approximate). Unusually sensitive people should consider reducing prolonged or heavy exertion outdoors. This is the standard guidance of the scale, not medical advice.

Where in Tokyo is the air worse?

Highest current reading: 23.0 µg/m³ (SC #53658). Lowest: 8.0 µg/m³ (日比谷交差点 (環境省 大気汚染物質広域監視システム(そらまめくん) — 東京都)). The list shows every sensor, highest first.

Where do these data come from?

From Atmy sensors and connected public networks (citizen, experimental and government monitors), aggregated by Atmy. Values are approximate; see the methodology.

How often is this page updated?

The summary is rebuilt every 15 minutes from the latest reading of each sensor, each no older than one hour.

Data

Where do these data come from?

The daily value is the Data Hub’s: the mean of the city’s sensors that passed the nightly quality check, each with at least 12 valid hours, and only with sensors at four places 500 m apart; days are UTC.

“Now” uses the same sensors and rule: the mean of their latest readings, each at most 60 minutes old, shown only with sensors at four places 500 m apart reporting.

Source: public Atmy monitoring data. Methodology and data sources · Data terms