China · The summary is refreshed every 15 minutes.
November 12
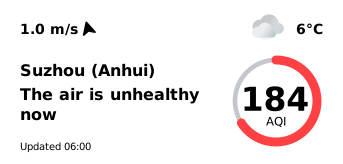
The air is unhealthy now
Measured 05:00
Suzhou (Anhui)
6°C
Cloudy
184AQI
1023
hPa
Atmospheric pressure
85%
Humidity
Suzhou (Anhui), November 10, 2026: daily mean PM2.5 42 µg/m³ (4 sensors), level “Elevated” — as in the Atmy Data Hub. Now (06:00 local time): 103.0 µg/m³. Open methodology and data in JSON: Methodology and data sources · JSON
Right now in Suzhou (Anhui), PM2.5 averages 103.0 µg/m³ — “unhealthy” on the US EPA scale (approximate, from hourly readings). Mean of 4 sensors from Government stations, readings from 05:00–05:00 local time (21:00–21:00 UTC), summary prepared at 06:00 local time. Median: 102.0 µg/m³; range across sensors: 94.0–114.0 µg/m³.
In Suzhou (Anhui) the air is unhealthy 🔴 AQI 184. Higher than three hours ago. ☁️ +6 °C · No precipitation · Wind 1 m/s
In Suzhou (Anhui) the air is unhealthy right now (approximate, US EPA scale). From 17:00 to 06:00 local time the city mean PM2.5 rose from 24.5 to 103.0 µg/m³.
Light wind (1 m/s) in the evening or at night, as the air cools, possibly traps particles near the ground (a temperature inversion). High humidity (85%) possibly makes optical sensors read somewhat higher.
Weather now: cloudy, 6°C, wind 1 m/s, humidity 85%. No major change in the wind is expected in the coming hours. By 17:00 the temperature will be about 13°C.
Written automatically at 06:00 local time (22:00 UTC) from sensor measurements and the weather forecast. Values are approximate; hypotheses are marked.
1 m/s
Wind, SSE
0 mm
Precipitation today
Suzhou (Anhui): air quality for the completed day
Metric: PM2.5, µg/m³ · Color scale: EPA AQI · November 10, 2026 · 00:00–24:00 UTC = 08:00–08:00 UTC+8
42 µg/m³ Elevated
Daily mean PM2.5 on November 10, 2026 (00:00–24:00 UTC = 08:00–08:00 UTC+8): 42 µg/m³ from 4 sensors that passed the quality check — the same value as in the Atmy Data Hub.
No. 30 of 100 cities in China and No. 70 of 676 worldwide, from the most polluted.
LowModerateElevatedHighVery highExtremely high
Air Quality in China for the Completed Day
Metric: PM2.5, µg/m³ · Color scale: EPA AQI · November 10, 2026 · 00:00–24:00 UTC
What was the air quality in Suzhou (Anhui) over the last completed day?
Daily mean PM2.5 on November 10, 2026 (00:00–24:00 UTC = 08:00–08:00 UTC+8): 42 µg/m³ from 4 sensors that passed the quality check — the same value as in the Atmy Data Hub. No. 30 of 100 cities in China and No. 70 of 676 worldwide, from the most polluted.
What is the air quality in Suzhou (Anhui) right now?
Right now in Suzhou (Anhui), PM2.5 averages 103.0 µg/m³ — “unhealthy” on the US EPA scale (approximate, from hourly readings). Mean of 4 sensors from Government stations, readings from 05:00–05:00 local time (21:00–21:00 UTC), summary prepared at 06:00 local time. Median: 102.0 µg/m³; range across sensors: 94.0–114.0 µg/m³.
Is it safe to be outdoors in Suzhou (Anhui) now?
The current level is “unhealthy” (US EPA scale, approximate). Everyone should reduce prolonged or heavy exertion outdoors; sensitive groups should avoid it. This is the standard guidance of the scale, not medical advice.
Where in Suzhou (Anhui) is the air worse?
Highest current reading: 114.0 µg/m³ (皖北煤电集团 (中国环境监测总站 (CNEMC) — 国家城市环境空气质量监测网)). Lowest: 94.0 µg/m³ (远航博物馆 (中国环境监测总站 (CNEMC) — 国家城市环境空气质量监测网)). The list shows every sensor, highest first.
Where do these data come from?
From Atmy sensors and connected public networks (citizen, experimental and government monitors), aggregated by Atmy. Values are approximate; see the methodology.
How often is this page updated?
The summary is rebuilt every 15 minutes from the latest reading of each sensor, each no older than one hour.
Data
Where do these data come from?
The daily value is the Data Hub’s: the mean of the city’s sensors that passed the nightly quality check, each with at least 12 valid hours, and only with sensors at four places 500 m apart; days are UTC.
“Now” uses the same sensors and rule: the mean of their latest readings, each at most 60 minutes old, shown only with sensors at four places 500 m apart reporting.
 November 12